

Market Insight #3 — Where to Place Stop Losses
Hello everyone, and welcome to the third edition of my Weekly Market Insights.
Market / Indicator Update
Markets started the week lower after Trump floated the idea of acquiring Greenland and applying pressure on the EU. In response, the EU talked retaliation, including deploying troops to Greenland. Honestly, this feels more serious than the usual headline. But I’m not a geopolitical analyst, and from a market perspective, these types of events usually don’t have lasting impact. Here’s a quick table showing how markets have reacted to past geopolitical shocks:
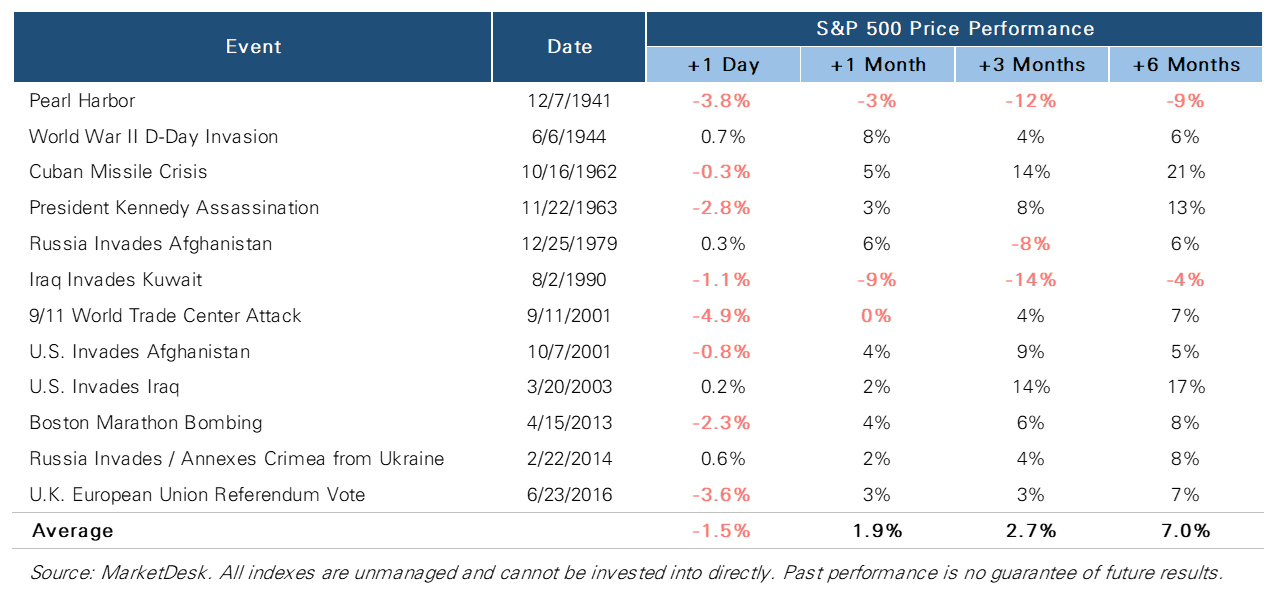
This is SP500 return as Bitcoin is new assets and doesn't have enough data — this is a good proxy for now.
There’s no consistent pattern in the short term, but the average market is up after one, three, and six months. That doesn’t mean this event is bullish, it just means it’s noise until proven otherwise.
More relevant is the pattern we’ve seen recently, the TACO (Trump Always Chickens Out) Trade : Trump threatens something big, markets sell off, then he backs down, market proceed to new all time highs. For now, I’m treating this as another chapter in that playbook.
Taken all this into account, I'm treating this as short-term noise.The plan hasn’t changed. I’m holding current positions. If I’m right, prices grind higher over time. If I’m wrong, the stop losses kick in and cap the drawdown. Either way, I don’t plan to overtrade this.
Where I Place Stop Losses
Last week I explained why I don’t rely on diversification in crypto, and why I use stop losses instead. This week, let’s talk about where I place them. First off, this assumes you already have a reason to be in the trade. If not, go back to Insight #1. I explain the thesis behind the portfolio there.
There’s no one-size-fits-all rule for stop placement, but here are the three methods I use most often:
1. Swing Lows
This is the simplest and the one I use most often. Look to the left of the chart. Find the most recent area where price stopped falling and reversed. That’s a swing low, a level where buyers stepped in. If price breaks below that level, the original idea is probably wrong. I usually place stops just below that line. There’s no strict rule on how far back to look. Sometimes it’s a few days, sometimes it’s months. It depends on the timeframe of the trade and the structure of the chart.
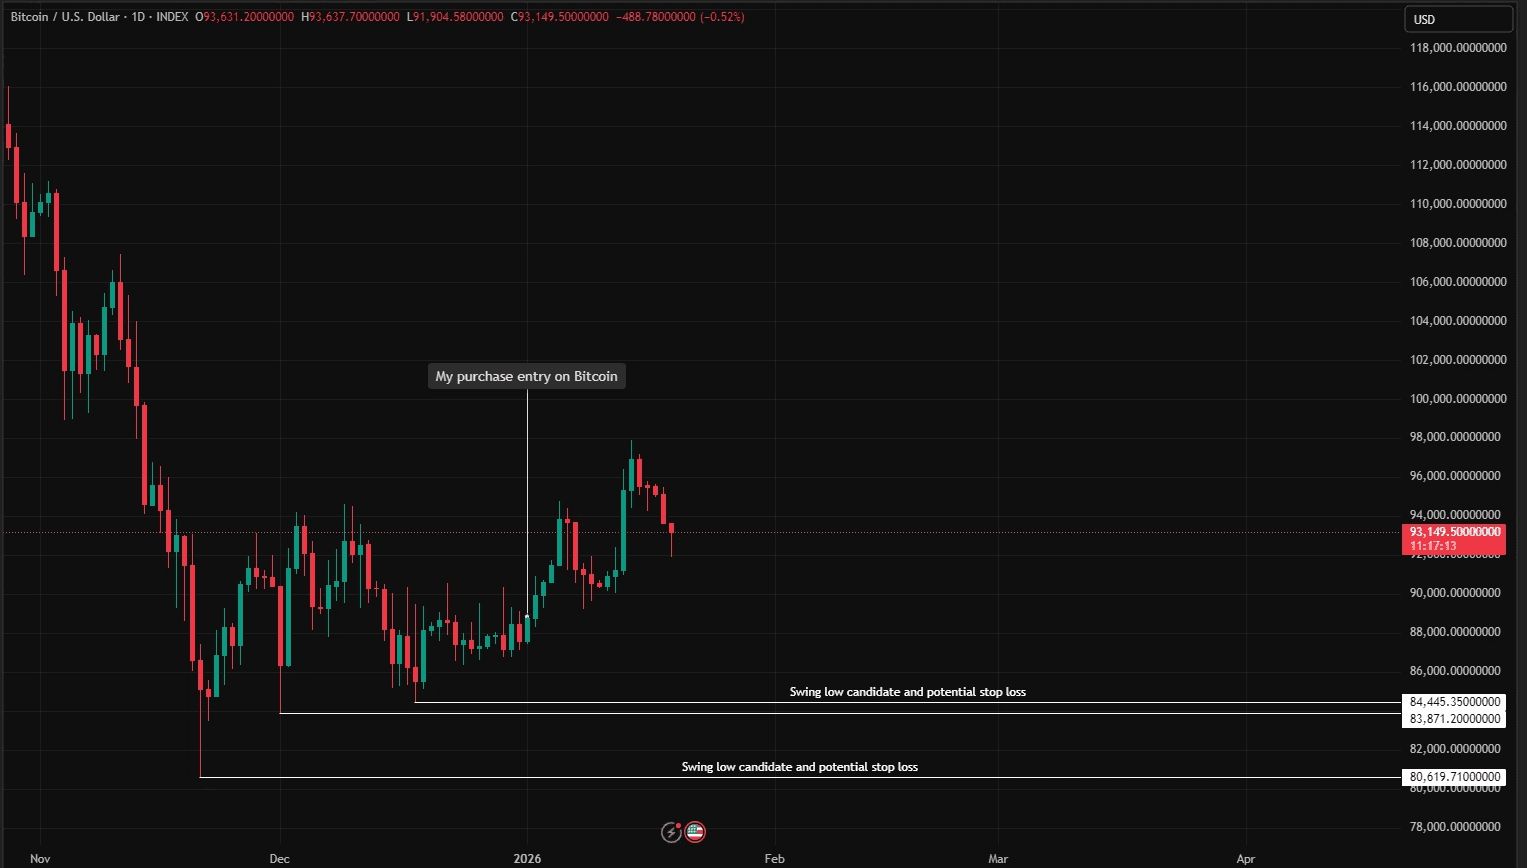
For instance, here’s the Bitcoin chart showing where I entered my position. I’ve marked three potential swing low levels that could serve as stop loss candidates. I ended up choosing the lowest one. I chose this level because I wanted to be conservative and give the trade more room to breathe. Crypto is volatile, it’s common for price to dip into these zones before moving higher. If my thesis is right, I don’t want to get stopped out on noise.
By choosing a wider stop, I reduce the odds of getting taken out too early. Yes, it means a smaller position size, but I’m okay with that. Because I size based on the stop distance, the loss is the same regardless of which level I choose. The only difference is the return potential. Smaller size means slightly smaller upside, but it gives me more confidence and less stress. That’s a tradeoff I’m willing to make.
2. Volatility-Based (ATR)
This method is about giving the trade enough room to breathe. Markets don’t move in straight lines, and some assets naturally move more than others. The Average True Range (ATR) measures how much price typically moves over a given period — you can think of it as a rough measure of “normal” volatility.
A common approach is to place your stop at: Entry price − (ATR × multiple)
The multiple is often around 2. That means you’re allowing for normal price fluctuations, while still cutting the trade if the move goes beyond what’s typical. A higher multiple gives the trade more room but lowers your invesment sizeris, a lower multiple gives your a bigger size but increases the chance of getting stopped out early. ATR is widely available on most charting platforms like TradingView, and you can also simply google something like “Bitcoin ATR” to get a quick reference.
3. Liquidity & Volume
Look up Bitcoin volume profile on Google and you’ll see what this shows: the amount of volume traded at different price levels. In simple terms, it tells you where most of the trading happened, and where liquidity is concentrated. When I use it, I look for the largest volume area below the current price. This is where many participants transacted. It’s an area of acceptance, not rejection.If price is trading above that zone, the market is effectively saying: “Above here is fine. Below here, something has changed.” That’s why I place stops below high-volume areas, not inside them.
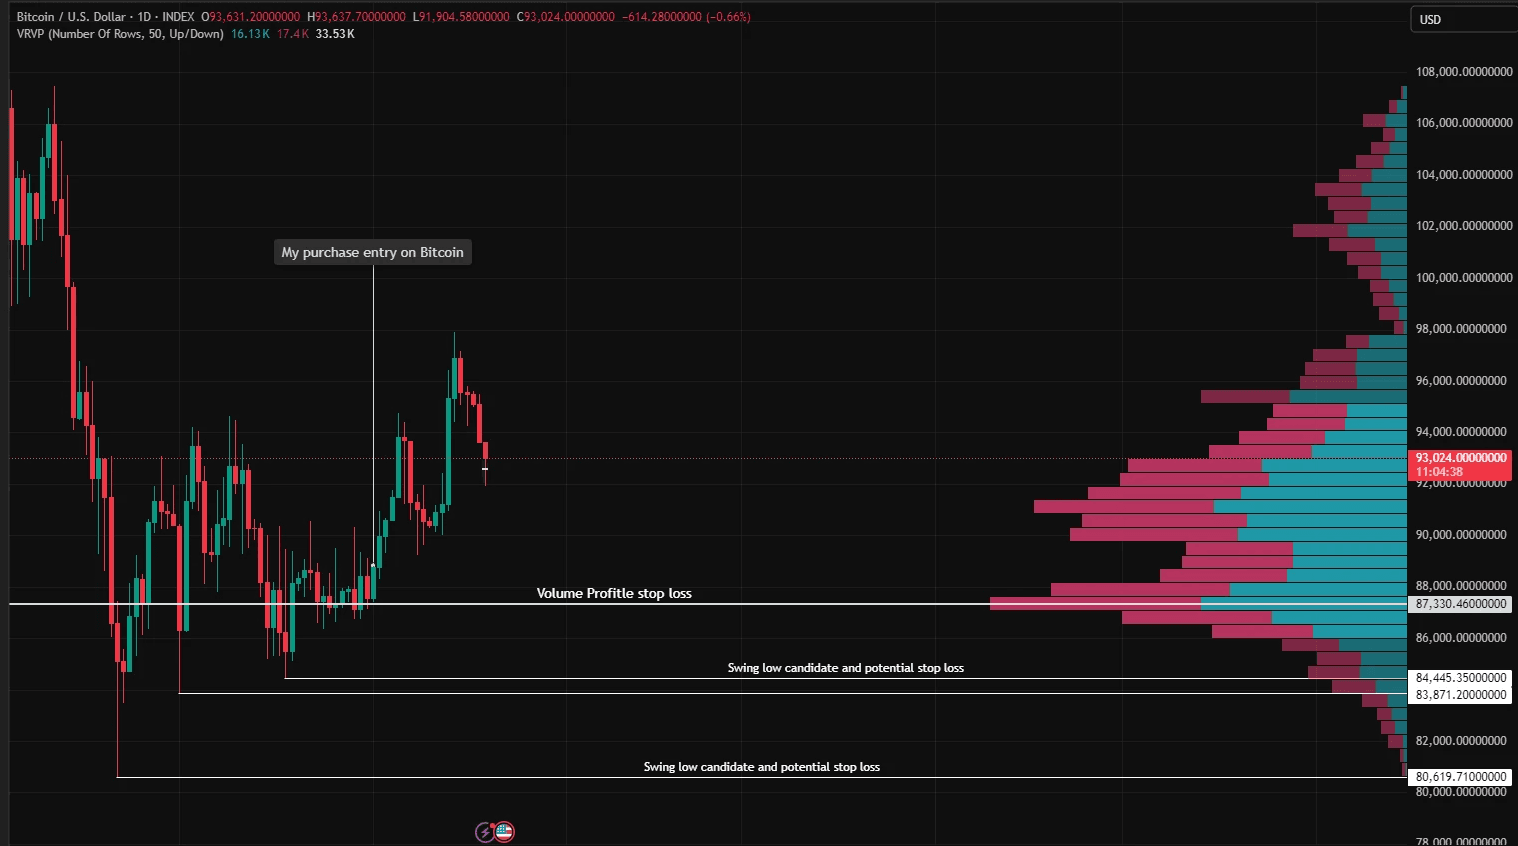
In the screenshot, you can see a large volume node around 87.3k. I’ve marked my stop just below the bottom of that volume cluster. If price trades back down through that entire zone, the bullish thesis is likely wrong. The market would be accepting prices it previously moved away from. You’ll also notice that this volume-based stop sits above the swing lows identified earlier. In this case, using volume profile would have resulted in a tighter stop, which would allow for a larger position size.
However, because crypto is volatile and often wicks into these areas before making a decision, I still chose to use the swing low stop. It gives the trade more breathing room. Even if price were to break below the volume-based stop, it would most likely continue toward the swing low anyway. I’m comfortable giving up some position size in exchange for higher conviction and less stress holding the trade. That tradeoff fits my style.
Which One Do I Use?
Ideally, if these different approaches point to the same level, you have confluence and a strong case for using that level as your stop loss. In practice, the swing low is usually the easiest and fastest method, and it often ends up lining up with the other approaches anyway. That’s why I recommend using it.
Regardless of how you choose your stop loss, position sizing comes after. Always define your invalidation first (your stop loss), and only then calculate your position size, not the other way around. If you want a step-by-step guide on that process, see Market Insight #2.
Looking Ahead
I’ll keep breaking down key topics in upcoming weeks. Here’s what’s coming next:
Macro : why I’m bullish and what I’m watching
On-chain: what I track short-term vs long-term
Asset selection: why I chose these names and how I evaluate others
Positioning: when to go big vs when to stay small
If there’s something else you’d like me to cover, or a question from the past few posts ,let me know.
That’s it for this week.
Stay patient. Stick to your process. And remember — protection comes before profit.
Trilux
Explore more blogs
Fintech is its potential to promote financial inclusion. In many parts of the world, millions of people lack access to traditional banking services.
